license

Where the stuff on this blog is something i created it is licensed under a Creative Commons Attribution-NonCommercial-NoDerivs 3.0 Unported License so there are no requirements to attribute - but if you want to mention me as the source that would be nice :¬)
Showing posts with label resources. Show all posts
Showing posts with label resources. Show all posts
Sunday, 14 April 2019
9mon #DUST #Sci-fi short - Planet Unknown
"Planet Unknown" by Shawn Wang - Facing global resource depletion, mankind sends out Space Rovers to find potentially inhabitable planets.


Monday, 26 February 2018
#ruralpresence - #Agricultural #festival resources

(this post was 1st published on the Rural Presence Blog)
In rural churches we don’t just celebrate harvest: there’s also Plough Sunday, Rogation and Lammas (and probably some more).
A new resource pack focusing on these four named festivals has been put together and test driven by Revd Janet Nicholls (Chelmsford Diocese Rural Adviser and Agricultural Chaplain), Mark Tiddy (Bradwell Area Youth Adviser) and Archdeacon of Chelmsford Ven Elizabeth Snowdon.
Alongside some theological context, there are also ideas to help with messy church, youth groups and collective worship in schools as well as traditional Sunday services.
Find details of how to obtain the pack in hard copy or download it from the diocesan website
Thursday, 26 January 2017
Monday, 8 June 2015
Digital & Data Journalism London News Impact Summit – 12 quotes + 18 resource links mega summary - then the detail
Last Friday I attended most of a News Impact Summit event taking place in the LSE's New Academic Building in Lincoln’s Inn Fields, London, UK. It was focusing on issues surrounding journalism and the digital domain and data journalism. I found it an interesting and informative day. This post covers ideas and quotes and resources that particularly caught my interest during the day. My thanks to the event's organisers and sponsors for putting it on.
Using my notes and other's tweets what follows immediately below is a mega summary of the whole day in 12 quotes and 18 links to resources. Then below that there is a more detailed write up. If anybody has notes on the sessions I didn't get to I'm happy to add those in with a credit. At the very foot of this post are links to other posts I've done that you may find useful.
Charlie mentioned that how even though there was more data than ever the publicity by the parties was more stage managed than ever before
the importance of mobile ...

election day traffic
- the BBC had a record election audience digitally - and the big story of the results played out quickly
- on news coverage of the campaigns the focus tended to be on the big story of the day (which was mainly dictated by the political parties media campaigns)
- is digital more heat than light? - turnout was down and youth voting % was bad
In the quick Q&A that followed these points interested me
- when recruiting for the team Megan looked for people who stood outside their realm (e.g. an academic frustrated with the pace of academia who could use their approach more quickly in journalism)
- data journalism is far more collaborative then "traditional" journalism due to the need for multi-discipline teams
Then Frederik showed us some clips from some broadcast data journalism
In the Q&A that then happened at the end of all of the panelist sessions these points interested me
- the Netherlands animations affected the public debate about the risk of flooding in the Netherlands and how evacuation wasn't an option (in the once every 10000 years scenario) as the bulk of the country would be flooded (so nowhere to evacuate to)
- they shared the data online for each local area
- to find the story in the data it helps if you have somebody who knows that patch
- one of the panelists discovered a Ghost Patients story when comparing data on how many patients some GPs had with the population for the area - they noticed that the GPs seemed to have more people on their registers than actually lived in the area
- its a difficult time balance between exploring the data versus meeting deadlines for a story - and yet still avoiding data churnalism
Returning after lunch we then has some choices of 1 hour workshop slots running two at the same time
Workshop 1 - Data journalism with financial data - with John Burn-Murdoch - I didn't attend this and at the same time Workshop 2 - Google geo tools for journalists - with Matt Cooke
google alerts is a good way of keeping up to date with the latest on specific subjects on the web or on social media
If you want information on storytelling using google maps - and getting the latest imagery - try the link in the tweet below
Fusion tables is a way of fusing 2 sets of data to create a map of such data - so examples given included
- a map of military deaths in Iraq
- or a map of a city in terms of hotel rates and airbnb rates
- or a map showing firearm ownership
You can make custom maps using google my maps - for example see the picture in the tweet below showing what one news organisation did concerning the flight path of a plane and adding their own custom legend (on the left) to indicate events during that flight
if you are mobile there is a google maps android app that journalists can use for reporting from the field
and for further maps customising (programming skills needed) you can use google maps api
or you can compare street views over time - so an example of this before and after approach on an areas gentrification is shown in the picture in the tweet below (to use this feature go to google street view using the stickman - then look for the clock symbol in the panel toward the top left hand corner - clicking on this you can see which street views from which dates in history are available)
- fly through 3D videos
- or views of areas remote from access (e.g the oil refinery hostage story in Algeria)
there is also google crisis response as a resource - see the tweet below
Workshop 3 - Engagement through data for better storytelling - with Alison Rockey (Engagement Editor, VOX.com )
Alison explained what Vox is about
and by way of an example of the working out of the mission statement above - she cited the way they did an interview with Obama and added in various graphics
In building a social newsroom Alison explained how they wanted
- everyone (technical & journalists & product specialists) working together in the same space so they could understand each other
- so that it became a newsroom of social experts
- so writers know how their stories perform on social
- so there are weekly lessons on best practices
Alison went on to stress the importance of knowing your audience and why they share stuff socially
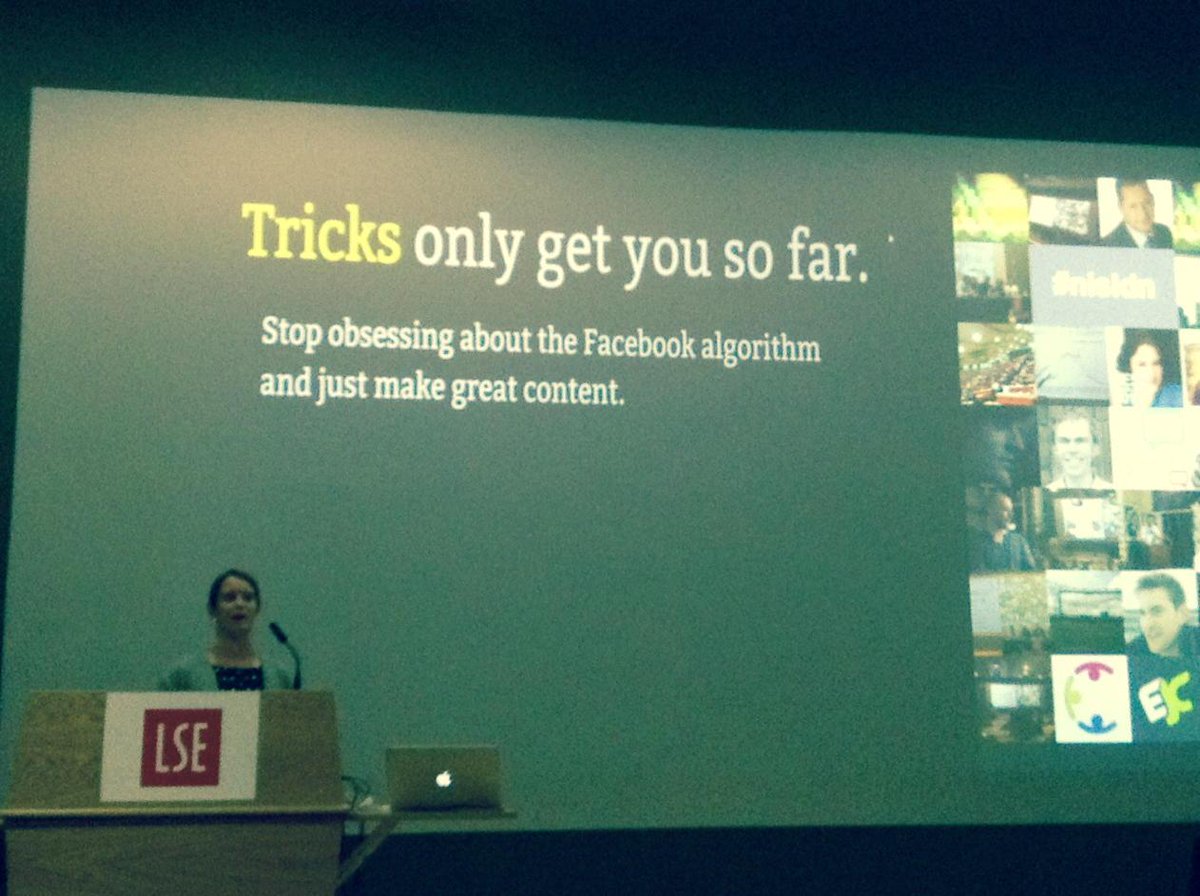
she also had some advice about algorithm fixation
they created the Ebola graphic - (which with a hindsight view appears from a UK perspective to be snarky - but from what Alison said it wasn't done with that intent) because
a) when the 1st Ebola case was reported in the USA people really were freaking out about it
b) so they wanted to create something to inform & calm the situation down
c) and they were able to do the graphic because behind it was work they had already done - based on some solid journalism where the experts had been talked to in detail so the journalists knew how Ebola actually spread
In summary her advice was direct and clear
In the Q&A that followed the following issues interested me
Workshop 4 - War crime investigation: finding evidence through UGC - with Christopher Koetti (Advisor on technology & human rights, Amnesty International) - I didn't attend this
Workshop 5 - Animating data for visual storytelling - with Frederick Ruys - I didn't attend this
Workshop 6 - Using Google tools for journalistic research - with Paul Myers (Researcher, BBC) - I didn't attend this but have picked out some of the relevant tweets below
Panel Debate 3: War investigation & user-generated video verification - I didn't attend this
General Session - Prototyping the future of news - I didn't attend this but have picked out some of the relevant tweets below
2015
2014
2013
2006 twittr launches
2005 youtube
2004 the facebook online and digg
2001 wikipedia
1999 weblog software launched
1998 Google
1996 HoTMaiL
1995 auctionweb
1994 CERN release a web browser
1984 Apple Macintosh launched
1977 IBM personal computer
1976 mail via computers
 frédérik ruys
Using my notes and other's tweets what follows immediately below is a mega summary of the whole day in 12 quotes and 18 links to resources. Then below that there is a more detailed write up. If anybody has notes on the sessions I didn't get to I'm happy to add those in with a credit. At the very foot of this post are links to other posts I've done that you may find useful.
mega summary & resource links
mega summary
on #ge2015 ...
on data journalism ...
on digital newsrooms
mega summary
on #ge2015 ...
the 2015 election was 'weird & boring' with most parties maintaining strict message control, sticking to their story, staying vague & not engaging with their opponents stories
|
even though this was the most digital election so far - is digital more heat than light? - turnout was down & youth voting % was bad
"Journalism cannot save the world. It's struggling to save itself"
|
"there is a massive danger that the media over-estimate its own sophistication versus that of the GB electorate (which is very sophisticated)"
|
the Conservatives focused a lot on local advertising for specific seats they were targeting - and this wasn't seen from the national media's perspective
|
on data journalism ...
you need to learn how to talk to developers - in the 1st year you'll probably scream at each other
|
data journalism is far more collaborative then "traditional" journalism due to the need for multi-discipline teams |
the data you collect and your analysis of it gives you a competitive advantage
|
some of the more interesting Government data is often not released
|
on digital newsrooms
look for people who stand outside their realm (e.g. an academic frustrated with the pace of academia who could use their approach more quickly in journalism)
|
have the techies & products & journalists together in the same space so they understand each other & become a newsroom of social experts
-
|
help writers know how their stories perform on social & have weekly lessons on best practices |
know your audience & where they are - only post great content - post it in a way that shows it off best |
A more detailed write up
Intro - The summit kicked off with an introduction by the reps of the main sponsors ...
|
Wilfried Rutten (Director, European Journalism Centre) gave a brief intro to his organisation, and a few of the interesting resources they have (e.g. verification publications) and invited people to apply for the grant scheme they run. (yes you did read that right)
|
Matt Cooke (European Lead, Google News Lab) talked about their digital news initiative and some of the tools they had which could help journalists. He invited people to contact him about setting up visits to newsrooms to educate teams

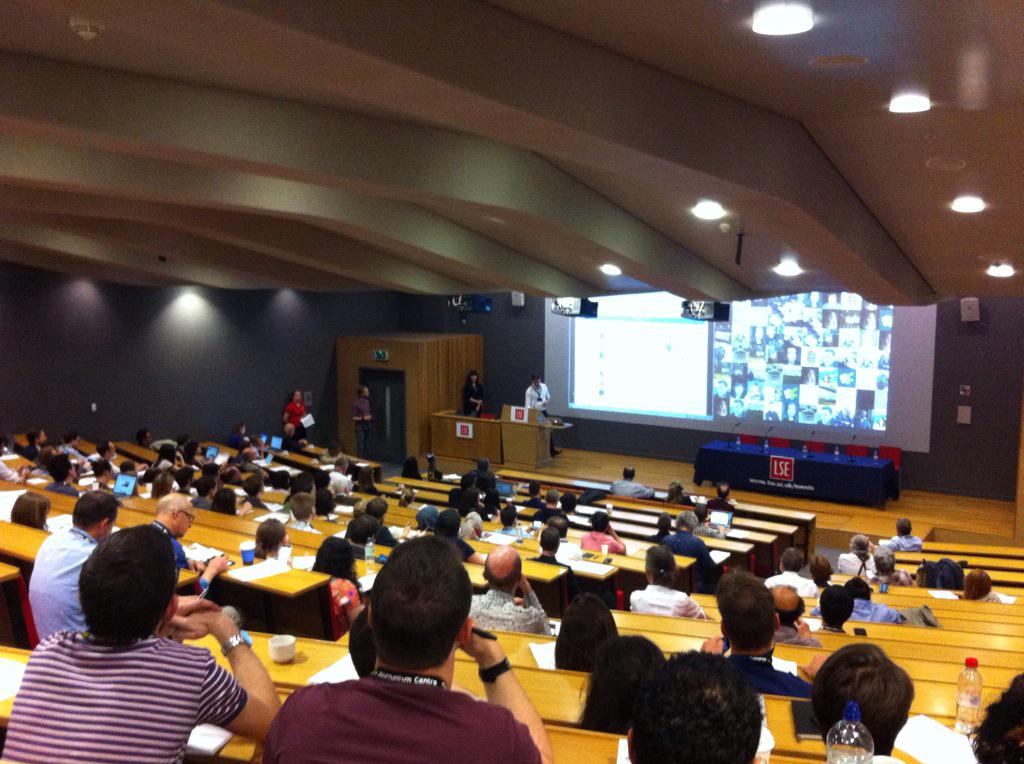
And we're off with an intro from Google's @mattcooke_uk #NISLDN
|

1st Panel Debate - Looking Back #GE2015: From the leading UK media perspectives
 Rohan Jayasekera
On the panel (from left to right in the pic above) were:
Steve Herrmann (Editor, BBC News Online)
Miranda Green (Contributing Editor, Newsweek, Europe) the moderator of the panel - Charlie Beckett (Polis at LSE) Jason Mills (Head of Digital, ITV News) Tom Phillips (Editorial Director, Buzzfeed, UK) |
The format of the debate was that each of the panel talked for a bit and then the debate opened up to questions from the audience.
|
Some of the points Miranda made on some of the features of the election coverage were:
- the "debate about the debates"
|
- the difficulty in crystalising the parties views on the fundamentals (vs the noise)
|
as concerns the poll predictions pre election day
|

- the New Statesmen's coffee house blog
- how getting a story into print was still seen as the prestige thing
|
- the polls and political betting
- digital was very good at giving visibility on the scottish issues
|
- the narrowcasting (vs broadcasting) that went on
- how much of the imagery that made good articles was "traditional" (e.g. Osbourne in a hi-vi)
|
Charlie mentioned that how even though there was more data than ever the publicity by the parties was more stage managed than ever before
Steve (BBC) then shared some graphs and thoughts ....
the importance of mobile ...
 Mevan. Me and van.
- how traffic spiked by the BBC's different pages (e.g. the day after there was massive interest in the BBC pages on the results for each constituency) - see tweet below
 Catalina Albeanu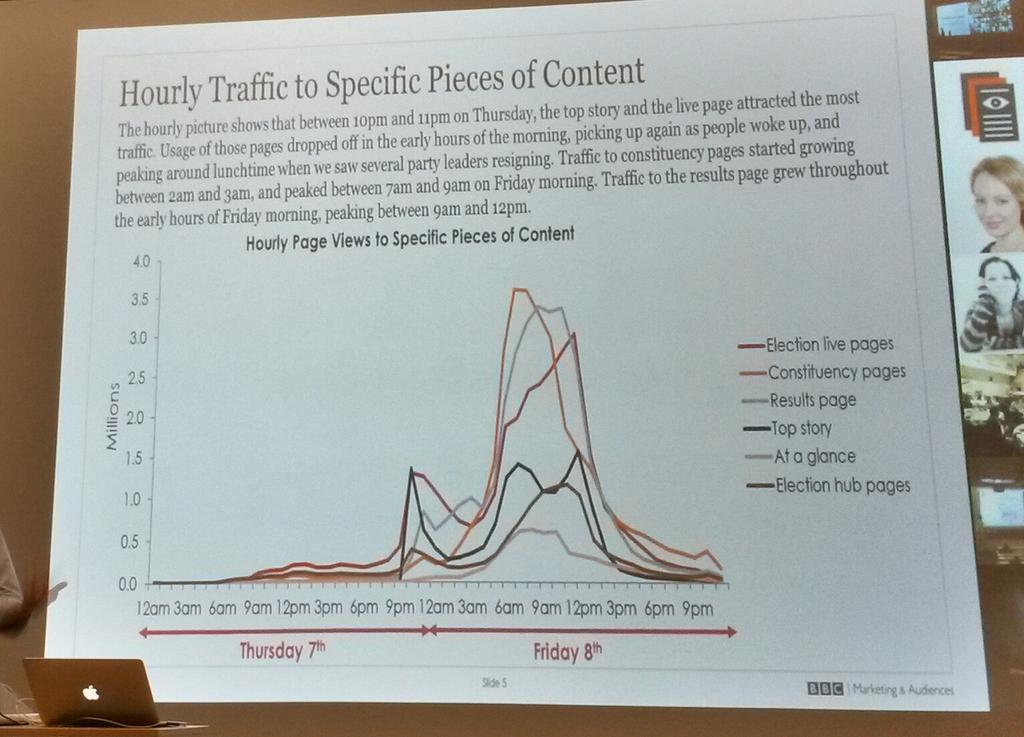
election day traffic
- How traffic spiked on election night for BBC News Online #NISLDN @BBCSteveH


- the BBC's issue cards (giving background info and data on specific topics) had their highest traffic on election day - so presumably people were looking at the cards to help them choose which way to vote?
Jason then shared some thoughts from ITV's perspective
Jason then shared some thoughts from ITV's perspective
- mobile and social is how people got their content (the tweet below is about the BBC but ITV focused similarly)
- “We put a lot of effort into designing #GE2015 for mobile” – @BBCSteveH at News Impact Summit #NISLDN http://bit.ly/1KJ259c
 Martin Belam
- news items were largely directed and controlled by the parties - nothing seemed to break away from the stories the parties wanted to be told
- lots of short videos seemed to be key
- “We saw growth with Facebook video” – ITV’s @jasonmillsitv talks #GE2015 at News Impact Summit London #NISLDN http://bit.ly/1Mt2QEG
- ITV had a "Rate the Debate" survey that was open to all - it got 30m hits (although the discussion on this suggested there was probably a lot of party activist hammering away voting for their candidate)
Tom from Buzzfeed then talked a bit
- the politicians had very strong message discipline, they seemed to not engage with other parties messages and just kept in their own lane focusing on their message
- Traditional 1/2 hour interviews seemed to work best In the Q&A session that followed the following observations struck me ... |
- there was a big tie up between broadcast and social - but content needed to get up on social really quickly |
- Buzzfeed choose not to focus on data content (as the polls were so static pre election)
- Buzzfeed look at the ratio of sharing more than traffic volume and judge posts success in terms of do they find the audience that would want to read it (I assume their success in this is key to what premium in adds to their advert rates due to being more demographically targeted?)
|
- "We facebooked, we tweeted - Maybe we should have voted?" @greenmiranda recalls a cartoon on the data-discrepancy aftermath #GE2015. #NISLDN

- issues most talked about on facebook - economy & tax
- there were 2 standout debates - the ITV one - in that it really presented the multi-party dimension of the election
- and the BBC Question Time one - for the bluntness of the audience questioning and the strength of the reactions of the audience in the room to some of the dodging the politicians did
- Great question from audience member - were media so focused on chasing audiences that they stopped chasing stories? #NISLDN

- main stories at night seemed to be those in 1st edition print - and when early print editions dropped 9pm ish this could change how broadcast told the news
- Broadcast was desperate for stories but almost all the politicians were talking so vaguely it was hard to get any story other than what the parties were pushing
- is digital more heat than light? - turnout was down and youth voting % was bad
- "Journalism cannot save the world. It's struggling to save itself" – @CharlieBeckett #nisldn
 Etan Smallman
 - but maybe its unrealistic to expect media to change how the GB electorate think about politics
- the Conservatives focused a lot on local advertising for specific seats they were targeting - and this wasn't seen from the national media's perspective
|
- "you don't want to be the Dad dancing in the room"
"there is a massive danger that the media over-estimate its own sophistication versus that of the GB electorate (which is very sophisticated)"
|
2nd Panel Debate - From Data gathering to visual storytelling

On the panel (from left to right in the pic above) were:
Frederik Ruys (Data Journalist, Nederland Van Boven -VPRO)
Helena Bengttson (Editor Data Projects Team , the Guardian)
Rohan Jayasekara who moderated (he is Technology Hub Adviser, Internews)
Megan Lucero (Date Journalism Editor, the Times & Sunday Times)
John Burn-Murdoch (Data Journalist, the Financial Times)
The format of the debate was that each of the panel talked for a bit, John then interjected a few questions after each session - and after all the panelists had talked the debate opened up to questions from the audience.
Helena talked about a number of stories where she had used data
- a fracking story using a visualisation on a map |
- reddit porn - looking at the moderators of the more shady threads and how they also moderate more mainstream threads - how large a part of reddit is shady
|
- interactive visualisations on pregnancies, income ranges, schools performance, education levels of parents |
In the quick Q&A that followed Helena's slot these points interested me
- for some of the maps it took 3 hours to create them
- Helena taught herself to code - but she did this only if she needed to do so for a story
- you need to learn how to talk to developers - in the 1st year she and a developer worked with each other they regularly screamed at each other
John from the FT then talked a bit
- you need to have somebody who knows the data - whatever the source - which column to look for
Not just a choice between publicly available data sets and paid ones, web scraping enables you to create your own - @jburnmurdoch #NISLDN
- the data you collect and your analysis of it gives you a competitive advantage
 Gemma McNeil-Walsh @gemmcneil link to this tweetIn data journalism, you get to break the exclusive AND you’ve got the data for follow-up + continual investigation @jburnmurdoch at #NISLDN
In the quick Q&A that followed these points interested me
- Companies are generally better now at releasing accessible data |
- some of the more interesting Government data is often not released |
- the amount of "scraping" going on is increasing
|
Megan from the Times then spokeClose

- our data journalism team is investigative and multi-discipline and uses computers to get data to support that investigative journalism "of the web not on the web" |
- Megan gave examples of matching lists of well know Tax Avoiders (think Jimmy Carr) with other lists to see trends |
- or how for the election they prepared election data with census data and used machine learning so when the results came out 1/2 an hour later they had a simple front end to their analysis up & public
|
In the quick Q&A that followed these points interested me
- when recruiting for the team Megan looked for people who stood outside their realm (e.g. an academic frustrated with the pace of academia who could use their approach more quickly in journalism)
- data journalism is far more collaborative then "traditional" journalism due to the need for multi-discipline teams
Then Frederik showed us some clips from some broadcast data journalism
In the Q&A that then happened at the end of all of the panelist sessions these points interested me
- the Netherlands animations affected the public debate about the risk of flooding in the Netherlands and how evacuation wasn't an option (in the once every 10000 years scenario) as the bulk of the country would be flooded (so nowhere to evacuate to)
- they shared the data online for each local area
- to find the story in the data it helps if you have somebody who knows that patch
.@fruys: Being a data journalist is simply that you interview datasets instead of people. #NISLDN View photo
|
Here's the Perils of #DataJournalism by @sarahoconnor_ mentioned by @jburnmurdoch #NISLDN http://blogs.ft.com/ftdata/2015/05/06/jobs-and-politics-the-perils-of-data-journalism/ …
|
 |
- one of the panelists discovered a Ghost Patients story when comparing data on how many patients some GPs had with the population for the area - they noticed that the GPs seemed to have more people on their registers than actually lived in the area
- its a difficult time balance between exploring the data versus meeting deadlines for a story - and yet still avoiding data churnalism
 Martin Stabe
 Workshop 1 - Data journalism with financial data - with John Burn-Murdoch - I didn't attend this and at the same time Workshop 2 - Google geo tools for journalists - with Matt Cooke
 Suchandrika
 google alerts is a good way of keeping up to date with the latest on specific subjects on the web or on social media
If you want information on storytelling using google maps - and getting the latest imagery - try the link in the tweet below
- Great Google tools to create custom maps, historical street views, fusion tables https://sites.google.com/site/geomedialab/ … #NISLDN #storytelling

If you want the detail on google's media tools use the link in the tweet below
- Google Media tools looks like a useful resource to create embeddable maps, fusion tables, custom street views #NISLDN http://www.google.com/get/mediatools/

Fusion tables is a way of fusing 2 sets of data to create a map of such data - so examples given included
- a map of military deaths in Iraq
- or a map of a city in terms of hotel rates and airbnb rates
- or a map showing firearm ownership
You can make custom maps using google my maps - for example see the picture in the tweet below showing what one news organisation did concerning the flight path of a plane and adding their own custom legend (on the left) to indicate events during that flight
- .@PhilipHahn mentioned Google News Lab at #HHDub on Tues & now @mattcooke_uk shows some work from @CTVNews. #nisldn!
 HacksHackersDUB
if you are mobile there is a google maps android app that journalists can use for reporting from the field
- You can dial down the @Google-ness of the maps and add your own branding, says @mattcooke_uk #NISLDN
or you can compare street views over time - so an example of this before and after approach on an areas gentrification is shown in the picture in the tweet below (to use this feature go to google street view using the stickman - then look for the clock symbol in the panel toward the top left hand corner - clicking on this you can see which street views from which dates in history are available)
- Blimey. @mattcooke_uk talking maps AND history AND storytelling and totally rocking my socks. #NISLDN

Or you can use the street view in google maps to show the street level view before an event - (like a major new building or a disaster) and then use the latest streetview pictures - or your own picture content - to show how it looked after the event - see the example in the tweet below (which has before and after pictures on a natural disaster)
Jeremy Walker @Jwalkerpress
or you can create a photosphere of inside a building and post that on google maps
and apparently you can use google earth to createJeremy Walker @Jwalkerpress
Very arresting treatment of post disaster coverage using Google maps but you do need to get the new images #NISLDN

- Using Google Earth you can download images of an area over time, to compile gifs (of stadiums being built etc) #NISLDN
- fly through 3D videos
- or views of areas remote from access (e.g the oil refinery hostage story in Algeria)
there is also google crisis response as a resource - see the tweet below
- Ah! @mattcooke_uk is moving on to Google Crisis Response: http://google.org/crisisresponse NGO's and journo's: check this out! <3 #NISLDN #emjo

On permissions and licencing the advice was that its OK to embed google map/earth images into blogs and such like but if you want to use their pictures in broadcast then ask google first
Workshop 3 - Engagement through data for better storytelling - with Alison Rockey (Engagement Editor, VOX.com )
- More info about the Vox card stacks here: Lessons in innovation from Vox Media https://www.journalism.co.uk/a565330 #NISLDN

- Beautiful use of annotation by @voxdotcom: http://www.youtube.com/watch?v=Icq60Uxd3As&sns=tw … Really adds depth to their interview with Obama #NISLDN
 Jenni Smout
 In building a social newsroom Alison explained how they wanted
- everyone (technical & journalists & product specialists) working together in the same space so they could understand each other
- so that it became a newsroom of social experts
- so writers know how their stories perform on social
- so there are weekly lessons on best practices
- Building a social newsroom step six - give feedback and celebrate wins @AllisonRockey #nisldn

Building a social newsroom step four - journalists are more than just writers @AllisonRockey #nisldn

- Building a social newsroom step three - make your content social @AllisonRockey #nisldn
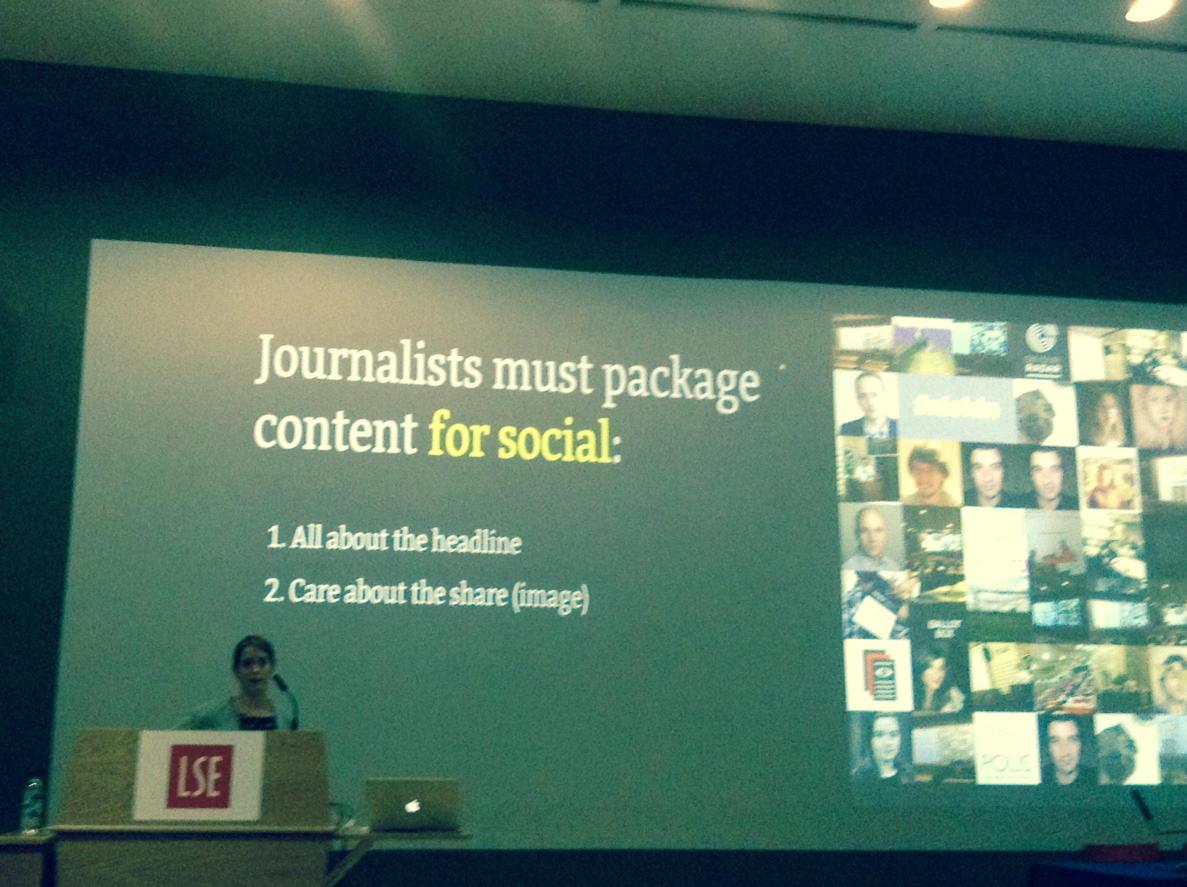
Alison went on to stress the importance of knowing your audience and why they share stuff socially
- I think we tend to ignore the second of these reasons people share content by @AllisonRockey #nisldn
 Charlie Beckett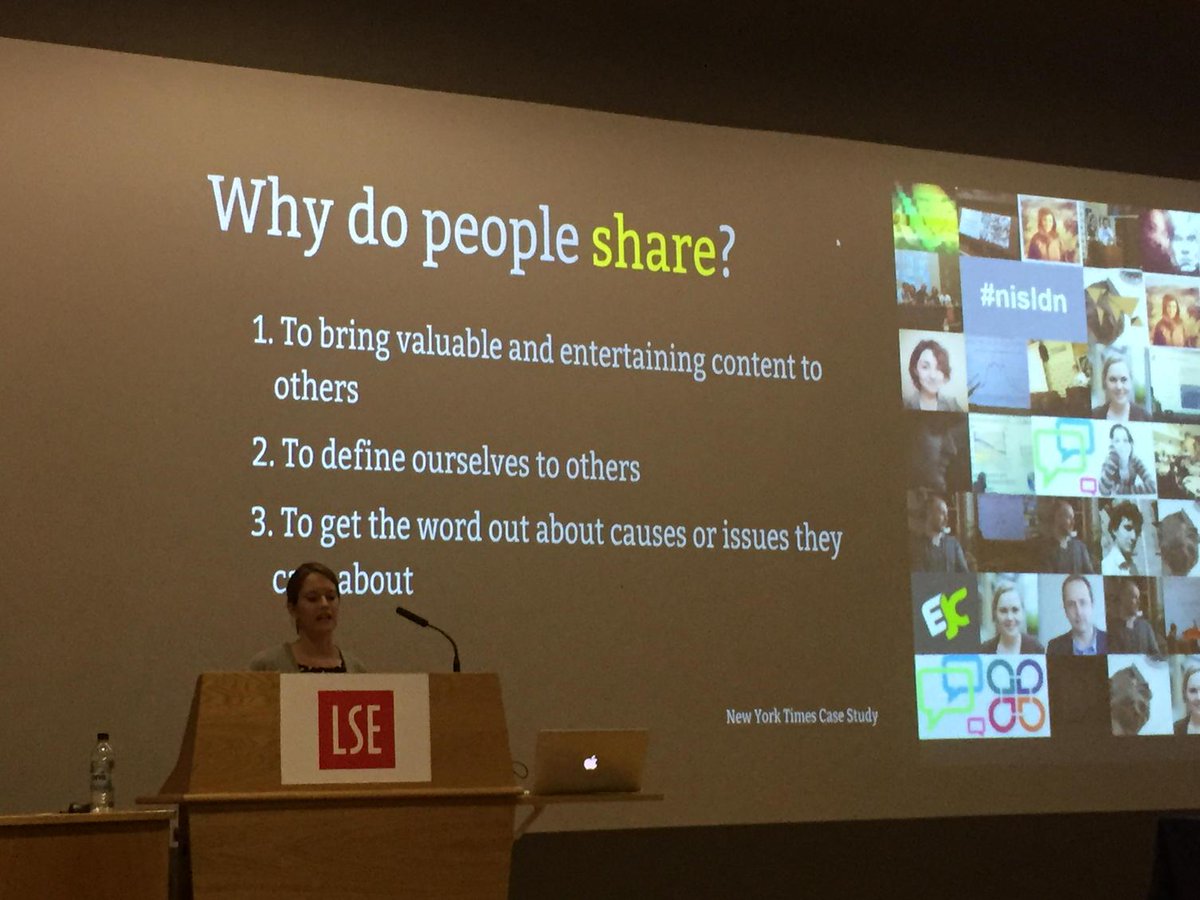
Alison also gave the example of the story behind the ebola graphic below ...
- Quick test 4 Ebola. What a good idea to take the reader to the facts http://www.vox.com/2014/9/30/6875459/calm-down-youre-not-going-to-get-ebola … @AllisonRockey at #NISLDN


they created the Ebola graphic - (which with a hindsight view appears from a UK perspective to be snarky - but from what Alison said it wasn't done with that intent) because
a) when the 1st Ebola case was reported in the USA people really were freaking out about it
b) so they wanted to create something to inform & calm the situation down
c) and they were able to do the graphic because behind it was work they had already done - based on some solid journalism where the experts had been talked to in detail so the journalists knew how Ebola actually spread
In summary her advice was direct and clear

In the Q&A that followed the following issues interested me
- they have a team of around 35 with some 20 or so writers and the rest work on the product
- yes their journalists get outside the office on stories
|
- the writers generally get their pieces out quickly and post several time a day
- yes they have to balance the quick win story with the deeper research needed for some stories
- they chose not to have an app as their website was designed with a mobile focus
|
- her background is advocacy - so she was thinking about how they make sure the viewer comes back, or signs up to an email newsletter or connect via social media
- they post every 45 minutes or so on facebook and every 10 minutes or so on twitter
- video on facebook does very well |
Workshop 5 - Animating data for visual storytelling - with Frederick Ruys - I didn't attend this

Workshop 6 - Using Google tools for journalistic research - with Paul Myers (Researcher, BBC) - I didn't attend this but have picked out some of the relevant tweets below
- Hey #NISLDN, I'll be up on stage in a few minutes explaining this: https://medium.com/@chrishutchinson/we-need-to-standardise-tools-for-journalists-and-here-s-how-9bde2e952f2b …
- Another packed room at #NISLDN. @researchclinic shows how to use Google Search & Facebook for research
 Matt Cooke

Live demo of The Journalist Toolbox: http://toolbox.timesdev.tools
|
|


General Session - Prototyping the future of news - I didn't attend this but have picked out some of the relevant tweets below
- Last panel of the day at #nisldn is looking at war investigation and user-generated video verification
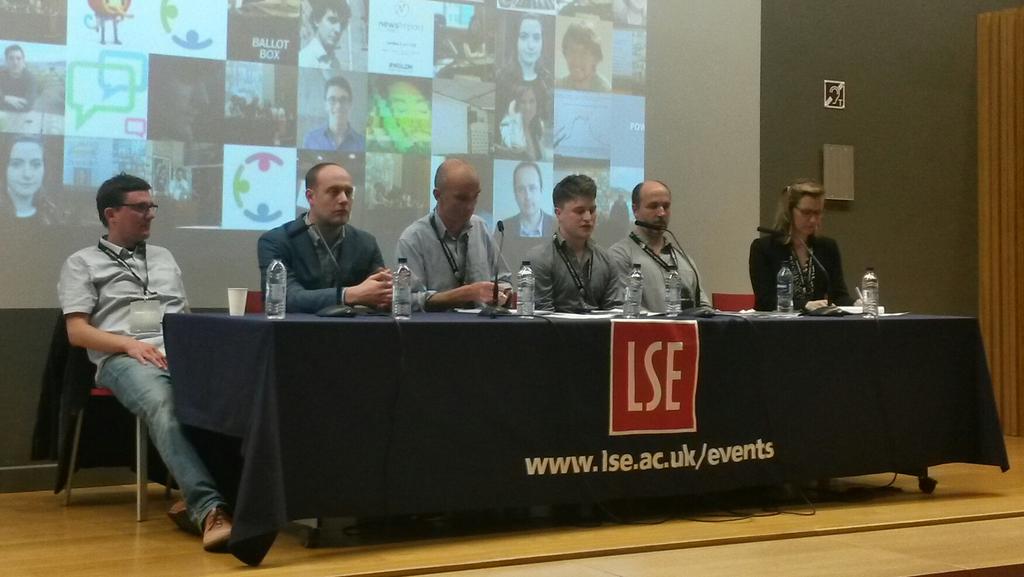
- Wendy Betts frm @eyewitnessorg: UGC is having profound legal implications re holding perpetrators accountable #NISLDN
 Hodan YusufPankhurst
- From the #NISLDN, also check out http://bit.ly/1FyBZSW , by @DartCenter: "Working With Traumatic Imagery" and why that can be difficult.
- A great point from audience: geo-location data is great for verification vs. can be dangerous for journo's on the ground themselves. #NISLDN
 Sophie Nicholson
other posts on RSA, TED, other lectures, conferences, others blog posts
2015
the importance of character - an RSA event with David Brooks
in search of a fuller life - an RSA event with philosopher Theodore Zeldin
18 management practices to measure good management & 10 conclusions on the data gathered on such across firms and countries - summarised out of this paper - Why Do Management Practices Differ across Firms and Countries? - by Nicholas Bloomand John Van Reenen
algorithmically enhanced confirmation bias - 6 uncomfortable facts about how facebook affects what we see - from a post by @nathanjurgenson
10 thoughts on some possible insights (& questions) from the UK Election results
11 headlines on why we use facebook & social media - summarised out of a very rich buffer post by Courtney Seiteron
The 10 problems which mean the process to allocate scientific funding is broken
where does creativity come from? - a @RSAEvents lecture by mathematician @Cedric_Villani @alexbellos
how to innovate & survive - by @markf212 (Mark Payne)
where does creativity come from? - a @RSAEvents lecture by mathematician @Cedric_Villani @alexbellos
how to innovate & survive - by @markf212 (Mark Payne)
18 top tips and thoughts about using #social media to enable #community source = an article by Anatoliy Gruzd PhD & Caroline Haythornthwaite PhD
2014
Data Protection & Privacy - 8 issues from an International Conference
escape your social horizon limit & understand more - source = a blog post summarising the work of Jeffrey A. Smith, Miller McPherson & Lynn Smith-Lovin
OECD - challenges for the next 50 years - in an OECD report
Want to help somebody - shut up and listen - by ermesto sirolli
social media & death - 10 things you may not have thought about - #DORS conference
persuasion and power in the modern world and the rise of soft power - UK House of Lords
2013
UK Government Policy Blunders & their common causes - by Anthony King & Ivor Crewe
the development of the U2 spyplane - source = CIA historians Gregory Pedlow & Donald Welzenbach
considering culture and business process improvement - source = an article by Schmiedel, Theresa, vom Brocke, Jan, & Recker
ideas that may help you attract older volunteers - source = a paper by Brayley, Nadine, Obst, Patricia L., White, Katherine M., Lewis, Ioni M.,Warburton, Jeni, & Spencer, Nancy
physical factors which help people get better quicker - source = a paper by Salonen, Heidi & Morawska, Lidia
guiding principles on designing construction kits - by Mitchel Resnick & Brian Silverman
signs of overparenting - source = an article by Locke, Judith, Campbell, Marilyn A., & Kavanagh, David J
making ideas happen - source = a 99U conference
2012
how to spot a liar - by pamela myer
ambiguity, irreverence, commentary & judgement - by lauren zalaznick
measuring happiness - source = talk by jim clifton, jim harter, ben leedle
2006 twittr launches
2005 youtube
2004 the facebook online and digg
2001 wikipedia
1999 weblog software launched
1998 Google
1996 HoTMaiL
1995 auctionweb
1994 CERN release a web browser
1984 Apple Macintosh launched
1977 IBM personal computer
1976 mail via computers
Subscribe to:
Posts (Atom)