license

Creative Commons License
Where the stuff on this blog is something i created it is licensed under a Creative Commons Attribution-NonCommercial-NoDerivs 3.0 Unported License so there are no requirements to attribute - but if you want to mention me as the source that would be nice :¬)
Showing posts with label digital. Show all posts

Saturday, 22 March 2025

Heathrow Closure - reporting on something going wrong

Today all forms of media reported chaos, anger and confusion as something went wrong with the electrical power supply to Heathrow Airport in the UK.

Hat tip for photo to Bao Menglong on Unsplash

One media expect commented that "In reporting on this I had to get my thesaurus out to explain the consternation, surprise, shock, distress and embarrassment this unprecedented disruption has caused with its huge and awkward impacts"

Politicians were quick to comment "Obviously its too early to comment as we don't have the full facts nor a considered root cause analysis of why this happened.  But I can say, with absolute certainty, that there will be questions that need to be answered.  And I intend to stand tall and ask those questions in a manner that in no way maximises my public recognition scores"

Expert pundits were able to add some light and insight to the closure.  As one said "As an expert in this area I have, in no way, previously pointed out Heathrow Airport's vulnerability to this sort of failure.  However I can say that there should have been contingency plans for such a possibility.  And of course I am able to assume in making such statements that the closure of the airport was in no way part of a contingency plan for such an event"

A newspaper owner has publicly stated "Thank goodness for these types of unexpected events, it really helps us in getting people to read my legacy media".  

Digital media influencers were also quick to use AI to write a short click bait headline article on the Heathrow closure, which conveniently linked to whatever product they are promoting without complying with advertising rules or declaring their income to the tax authorities.

Some of  the inhabitants of X have tweeted about how the closure was linked to some form of wokeness they dislike.  Whilst others have pointed out that the co-incidence of the airport and M25 closures were obviously a cover up for UFO landing at Heathrow.  

Too put all of this into perspective a business insider said "Once again this failure demonstrates how private equity investors in monopolistic enterprises can really help a business focus on maximising returns for investors, rather than wasting money on building resilience into operations"


Friday, 17 September 2021

Will office work ever be the same again? - recent BBC commissioned research

Yesterday morning the Radio 4 Today programme reported on some BBC commissioned research on this subject.  You can find out more info here, but some noticebale headlines were as follows:

"70% of those polled predicted that workers would "never return to offices at the same rate".

The majority orf workers prefer to work at home full or part time

50% of senior managers though staying at home adverely affects creativity and collaboration

But only 38% of the general public think the same"

The arguments for and against digitally workng from home versus physically being in the same office seemed to focus on four themes which I've unpacked a little below.

Creativity - not been physically together means less creativity.  

This might be true - but only for the people who are invited into the creative discussion in the first place.  Lets face it, often in an office only certain people are allowed to input to meetings/conversation seeking creative ideas and solutions.  The office admin is almost never invited to contribute to such discussion.  Plus this focus on physical ='s better creativity seems to focus on the assumption below that ...

Relationship & team building  - physically works better than digitally

At first glance this seems obvious - but maybe only if you are over 40.  Watch any bunch of teenagers or twenty year olds out socially and its obvious they are very comfortable interacting with others digitally - and often do so even when with others physically.  Or think about how many people using various "dating" apps to make contact with others and sus them out before investing time in a physical meeting.

Teaching others or learning with others physically - is better than digital learning

We've all being on really appalling physical training sessions where you watch the trainer read out what is on their slides.  Or where you are asked to role play out various situations with an ill thought out brief and dynamic.  Equally during lock down those of us having to using guided learning and assessment digital tools  - for compliance or health and safety training  - has seen how some of those digital tools amply illustrated that it can be too tick boxy in its approach.

Less commuting  - means less knackered people

But only if bosses don't try and claim the saved time back - either by wanting the saved time to spent on longer work hours, or by threatening people with saalry cuts if they don't come in physically using an argument that their living costs are less so they don't need the "London! allowance.  Hidden in all of this of course is the idea of being "present" been better - you have to be in the office to show commitment - even if your productivity is sometimes lower.

So what do you think?


Friday, 9 November 2018

1min 36sec #googlenewsinitiative clip - Product #Innovation with the New York Times


Text from youtube "As the way journalism is created, consumed, and supported continues to change, it’s become essential for news organizations to build nimble, innovative cultures to succeed in the digital age. 

For The New York Times, the largest combined print-and-digital circulation daily newspaper in the United States, building that culture has meant a willingness to boldly experiment with new technologies. Over the past few years, we’ve had the opportunity to collaborate closely with The New York Times on a series of partnerships that uses new technologies to meet business needs. 

Read more about the collaboration in the partnerships case study

Friday, 5 October 2018

20min @circulareconomy clip - Azeem Azhar - Why the #digital #revolution is really about values and people, 2018 Summit

Text from youtube "Early stage technology investor and author of the popular technology newsletter The Exponential View, Azeem Azhar, makes the case that in a world of rapid technological innovation, what really matters is the values and principles that are applied to the way in which we design the products, services and systems around us. 

The 2018 Summit took place at The Roundhouse in London on Thursday June 21st. Speakers discussed big ideas and world-views re-shaping how we view our economy, the role of digital technologies in making the previously unimaginable possible and shared stories of disruptive realities in business, cities and policy already happening today. Thank you for watching this video. 

The Ellen MacArthur Foundation is a UK charity working on business, learning, insight & analysis, and communications to accelerate the transition towards the circular economy.

Thursday, 21 June 2018

Monday, 11 September 2017

6min 39sec @theRSA clip - The #Attention #Economy is not on your side - this industrial scale #persuasion - with James Williams


Text from you tube 

"In May this year, James Williams, a former Google employee and doctoral candidate researching design ethics at Oxford University, won the inaugural US$100,000 Nine Dots Prize. James argues that digital technologies privilege our impulses over our intentions, and are gradually diminishing our ability to engage with the issues we most care about.

Thursday, 11 May 2017

#Data - The world's most valuable resource AND @KingsCollegeLon 's The #Digital Everyday - exploration or alienation

Last Saturday I attended a one day King's College London conference at their Strand Campus entitled "The Digital Everyday - Exploration or Alienation".  

In a serendipitous week the Economist magazine's leader and briefing was on digital data with a cover headline of "The world's most valuable resource".

In their leader the Economist describe data as the oil of the digital era.  They point out that with Alphabet (Google's parent company), Amazon, Apple, Facebook and Microsoft's dominance those companies use their vast pools of data to protect their dominant market positions.  In part the data they have means they can ID potential competitors quickly which they then acquire via "shoot-out acquisitions", (think Facebook and What's App) before they become a threat.

The article goes on to describe how the enormous amount of data collected - on what we buy (Amazon), what we share & like (Facebook), what we search for (Google), how we drive (Tesla), where we take taxis to (Uber) - allows these tech companies to identify and develop new services (or improve existing ones) in ways users want - so serving needs and attracting new users.  And because their competitors can't see the data they don't even know about some of the opportunities.

Given such analysis the Economist suggests antitrust authorities need to loosen the big companies grip on the data and open up Government's data to encourage competition (both with user's consent). Towards the end of the article the Economist covers the the tension between data portability and privacy and how people need help in understanding that their data has value and they are due some form of compensation when others use it.               


The Kings College conference came at the digital data issue from a  different angle.  

And slightly unusually for a tech/soc media conference it didn't have a #

The main themes I heard during the various sessions I attended are set out below.  

The full programme for the day is to the left of this text and the text below.

The twitter (or other) IDs I could find for the people who talked at the sessions I attended are - 
@jwajcman1 @paologerbaudo @girlslike_us @Caliviral @ianmtucker1 @tainab @RachaelCKent @mjgw 
@ideacritik 
@jrpybus 

@TupsTweets @susannapaasonen  samuel forsythe  tanya kent pinelopi troullinou

and the institutions that organised the conference @kingsdh @DigiCultureKCL 


Is our experience of time shaped by digital technology?

In the Opening keynote Judy Wajcman talked about how we describe and perceive the effect of technology on time so for example:

- Accelerating the pace at which things happen

- Changing our very perception of time (as did the second hand on clocks when first introduced)
                  

- Reinforcing speed as being best - technological determinism or as much culturally driven?

Reality check - earlier technologies were also “blamed” for speeding up & too much data

Not all of us are affected in the same way (e.g. taxi drivers wait to speed others to places)

- Time as an individual resource or as a collective accomplishment

- Information overload (e.g. email inbox) – equally due to collective norms on how we expect others to deal with emails


- Concept of time as a limited resource and so of value & so to be used productively.


So the idea of the digital affecting our experience and/or perception of time is something several have looked at ....


... and written books about ....


Our approach to digital technology

Judy's opening keynote, and Zeena Feldman's response touched on this issue.  Some of the issues mentioned that struck me are headlined below.

- Need to be more discriminating about when we use digital tecnology and be more demanding of it when we do

- Are we helpless victims or willing consumers?

- Should we be questioning more closely those who provide the devices and services in terms of their their bias and motivations?

- Is the technology a help in using “our” time productively by multi-tasking or is the practice of multi-tasking inherently less productive?

- In one of the slots in the 1st session after lunch Alessandro Caliandro talked about some research which tracked students use of smartphones and how they were always dipping in and out of using them - sometimes to kill time and sometimes to avoid stressful situations. 

When asked about misuse of smartphones some cited others hogging a digital environment with too much intellectual context.  When questioned about themselves people - of course - thought they got the balance of using smartphones for serious/silly/funny/heavy/light topics just right.


What do we actually want?

- In her response to the opening keynote Zeena Feldman pointed out that we are still figuring out how to live with these pocket computers.

- Its almost as though we're adolescents again - experimenting and trying things out as we begin to figure out who we are.

- All of which begs the question of what sort of life we want and how can digital technology help us achieve that.  Is the productive use of a time the morality that underpins the choices we want to make?  

How nuanced is the information we receive that we consider to be factual (eg the filter bubble that means my google search on a word will bring up different results from your search on the same word).  Is happiness what we pursue?  Are we human beings or human doings?


How much we share digitally and why


Self tracking devices - Rachel  Kent talked about her research on self tracking devices/apps and people's use of them.  Some of the use appeared to be motivated by a form of self policing where people used the app and the community to motivate themselves towards better exercise/eating/whatever regimes.  


Indeed the very use of such apps made people feel more healthy even if they were having a "lazy" day or the device had over reported their activity levels.  Equally when the app produced results that under reported activity there was genuine angst.


Digital Mental Health - Ian Tucker talked about the use of apps to help those with mental health issues and in particular an online supportive community app called Elefriends.  


He described from his research 

- the initial disruption participants faced when 1st using the community, 

- the quite profound level of sharing that occurred, 

- the concern if regular participants dipped out or deleted their accounts,

-  and the relief some participants felt in dipping out of using the site


Filling the Void - Social Media as depressive hedonia - Marcus Gilroy-Ware riffed on his reflections on our use of sites like facebook and how far it was compulsive or some form of escape or distraction from our unhappiness.  


In doing so he also highlighted the relentlessly positive language social media companies use to describe their products features  - for example newsfeed - and suggested we should challenge that language - perhaps triviafeed instead?


Digital Data Funerals - Audrey Samson talked about how difficult it is to delete data that is in the digital world and about Digital Data Funerals as rituals representing what data we wish could be - but can't be  - deleted. 


In workshops or via other means participants gathered together onto usb memory sticks the data they wished could be deleted so it could be embalmed or ritually destroyed.


Digital Surveillance


Quieting the Niche - Sam Forsythe discussed the effects on knowledge sharing and participation of surveillance - and counter measures against such and the way in which data was used to predict the patterns of people's lives.

Fertile Space - Tanya Kant talked about the Clear Blue Ads (pregnancy/fertility) on You Tube and the algorithmic anticipation  - of gender, age, wish to conceive  - to target such ads tp particular audiences. 

Set against this was the reactions of users against such categorisations and the doubly oppressive anticipation that females of a certain age would be interested in their fertility.  

In commenting on such she observed that how although such targeting was based on various correlations of data sets  = the way such data sets were described to users used more old fashioned marketing demographics language.


Digital learning - Pinelopi Troullinou talked about the data gathered from students during their study to help them analyse their learning and performance.  She described this "seductive surveillance" as offering quantification to students whilst being unclear about the risks of such data gathering.


Datification of student life.  Claire Tupling described the type of data now typically gathered in higher education "for the student's own good" and how discussion was less evident about ownership, consent, storage and application of such data.  She also remarked on all this data displacing the individuals as the subject of the analysis.


The closing plenary session was on Algorithms


Algorithmic Orientations - Taina Bucher talked about how we describe different platforms algorithms - how we ponder whether such have changed or are new or are frozen  - and how we react when we think the algorithim is not working in the way it serves stuff up to us that is "wrong".


Distraction - Susanna Paasonen reflected on how our attention is diverted - our our boredom diverted  - by what is served up to us  - and while she talke on this subject in the background she had projected a non-repeating sequence of interesting/amusing/diverting gifs.  

In /doing so Susanna touched on a number of issues ...

- our loss of focus/shortening of attention spans 

- but our increased capacity to handle information

- distraction not necessarily being the opposite of focus/attention


Friday, 26 February 2016

10 useful links (no. 19) - online museums, courses, sign builder, endangered sounds and more ...


earth & the moon from mars
links to the previous 18 lists are at the foot of this post

12 World-Class Museums You Can Visit Online - found via mentalfloss

power searching courses with google

a tool to search twitter - via a tweet from @readywriting found via @jess1ecat

facebook for non profits - found via steven.fogg

13 cheap or free digital skill courses

bbc academy - short instructional video clips on journalism, tv

chrome sign builder - found via church communications fb group

Gmailify, a new service that provides Gmail features to non-Gmail email accounts - found via laughing squid

museum of endangered sounds

free online courses - world religions through their scriptures

Previous 10 Useful Links posts 

No.'s 1234567891011121314151617, 18

Monday, 7 September 2015

10 useful links (no. 16) - includes you tube live streaming, pep talk generator, pew research data, tolkein reading the #Hobbit, 21 #twitter tools, #financial inclusion & others

links to the previous 15 lists are at the foot of this post

you tube live streaming - some helpful pages - found via ministrycommunicators

the pep talk generator - found via messynessychic

facebook media - some helpful pages - found via The CyberTheology Daily

How to access Pew Research Center survey data - found via @conradhackett

the national archives digital vaults - found via free technology for teachers

hear J R R Tolkein read from the Hobbit - found via brainpickings

21 Twitter Tools That Every Twitter Power User Must Know Of - found via The CyberTheology Daily

Access to & usage of affordable financial services across 21 geographically & economically diverse countries - all in the 2015 Brookings Financial and Digital Inclusion Project Report - found via @ErikBerglof 

fall invite resource kit - for churches

free childrens resources - for churches


Previous 10 Useful Links posts 

No.'s 1234567891011121314, 15,

Monday, 8 June 2015

Digital & Data Journalism London News Impact Summit – 12 quotes + 18 resource links mega summary - then the detail

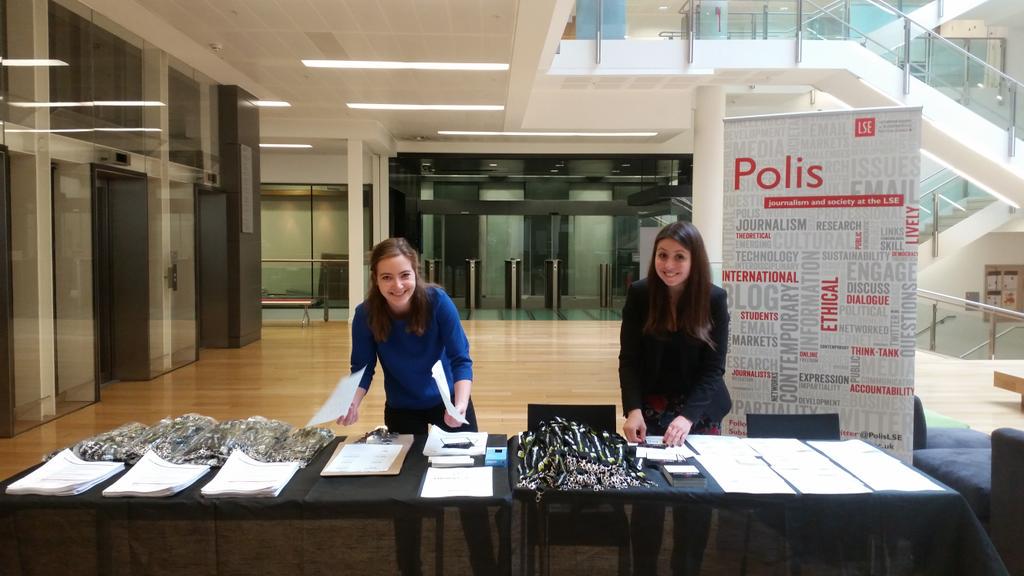
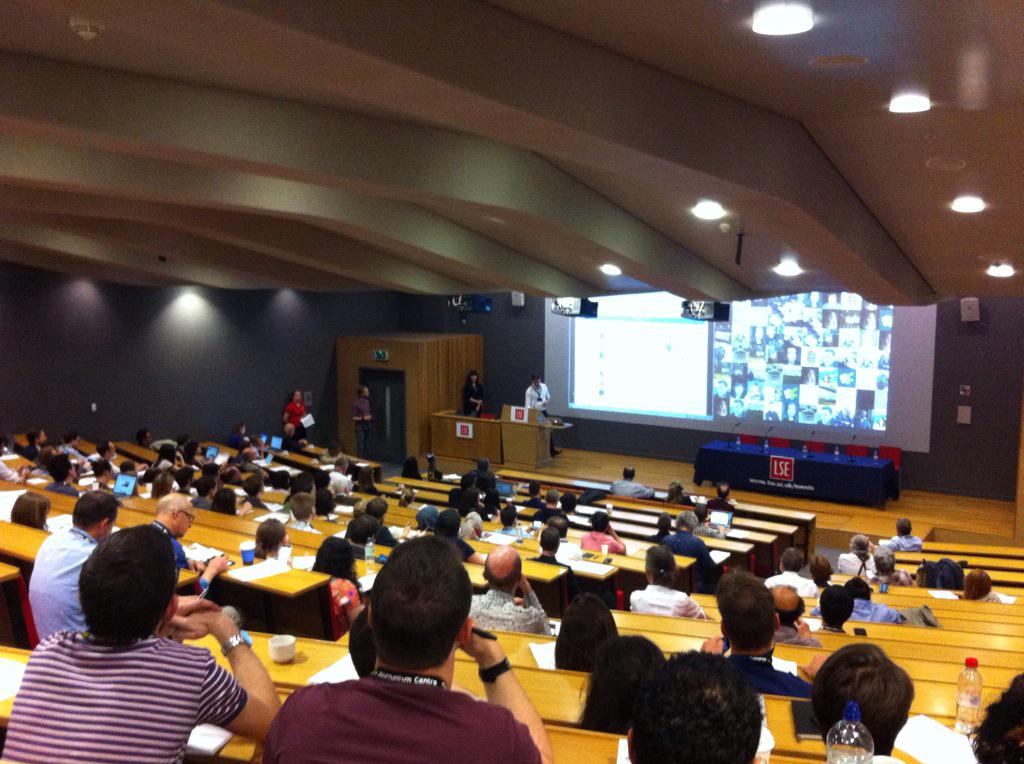
Last Friday I attended most of a News Impact Summit event taking place in the LSE's New Academic Building in Lincoln’s Inn Fields, London, UK.  It was focusing on issues surrounding journalism and the digital domain and data journalism.  I found it an interesting and informative day.  This post covers ideas and quotes and resources that particularly caught my interest during the day.  My thanks to the event's organisers and sponsors for putting it on.


Using my notes and other's tweets what follows immediately below is a mega summary of the whole day in 12 quotes and 18 links to resources. Then below that there is a more detailed write up.  If anybody has notes on the sessions I didn't get to I'm happy to add those in with a credit.  At the very foot of this post are links to other posts I've done that you may find useful.


mega summary & resource links


mega summary

on  ...


the 2015 election was 'weird & boring' with most parties maintaining strict message control, sticking to their story, staying vague & not engaging with their opponents stories

even though this was the most digital election so far - is digital more heat than light? - turnout was down & youth voting % was bad

"Journalism cannot save the world. It's struggling to save itself"


"there is a massive danger that the media over-estimate its own sophistication versus that of the GB electorate (which is very sophisticated)"


the Conservatives focused a lot on local advertising for specific seats they were targeting - and this wasn't seen from the national media's perspective

on data journalism ...

you need to learn how to talk to developers - in the 1st year you'll probably scream at each other


data journalism is far more collaborative then "traditional" journalism due to the need for multi-discipline teams


the data you collect and your analysis of it gives you a competitive advantage


some of the more interesting Government data is often not released

on digital newsrooms

look for people who stand outside their realm (e.g. an academic frustrated with the pace of academia who could use their approach more quickly in journalism)


have the techies & products &  journalists together in the same space so they understand each other & become a newsroom of social experts


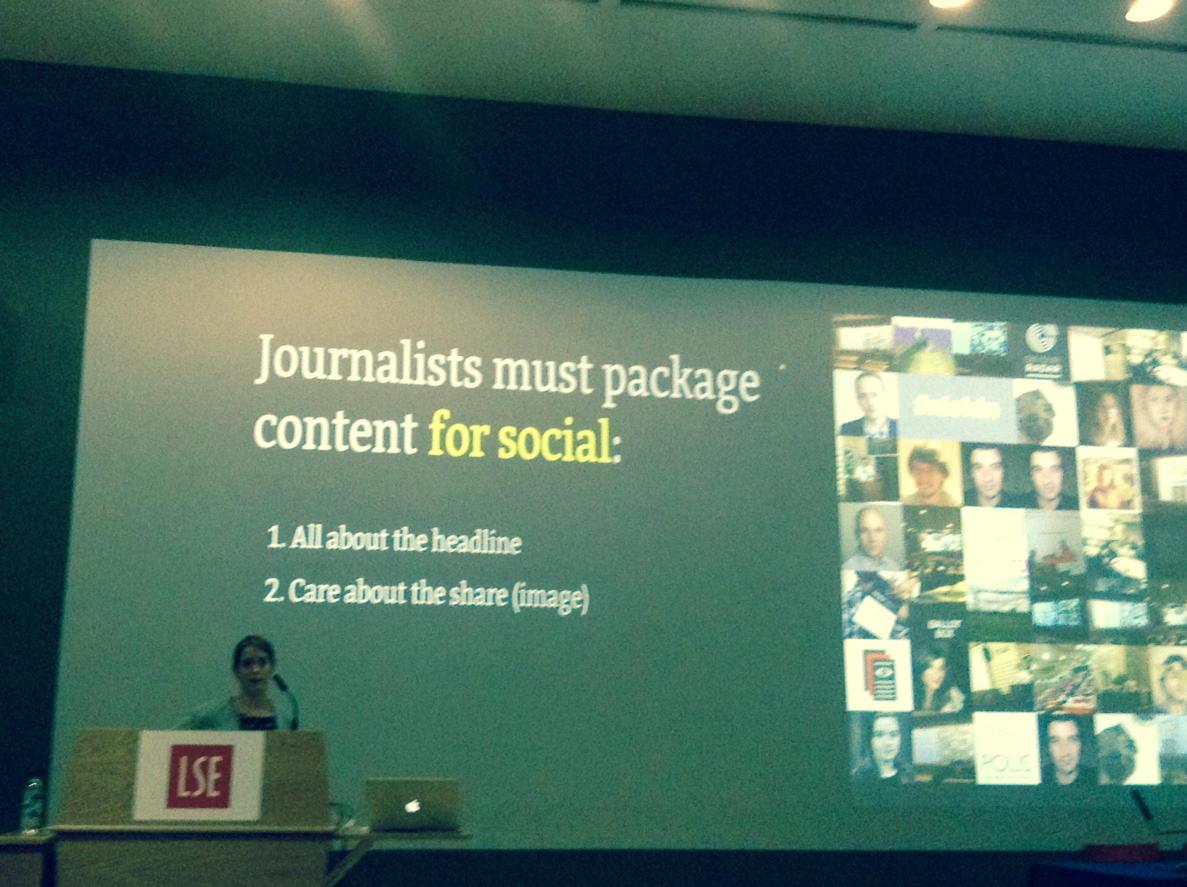
help writers know how their stories perform on social & have weekly lessons on best practices


know your audience & where they are - only post great content - post it in a way that shows it off best


A more detailed write up

Intro - The summit kicked off with an introduction by the reps of the main sponsors ...
Wilfried Rutten (Director, European Journalism Centre) gave a brief intro to his organisation, and a few of the interesting resources they have (e.g. verification publications) and invited people to apply for the grant scheme they run. (yes you did read that right)

Matt Cooke (European Lead, Google News Lab) talked about their digital news initiative and some of the tools they had which could help journalists.  He invited people to contact him about setting up visits to newsrooms to educate teams
And we're off with an intro from Google's


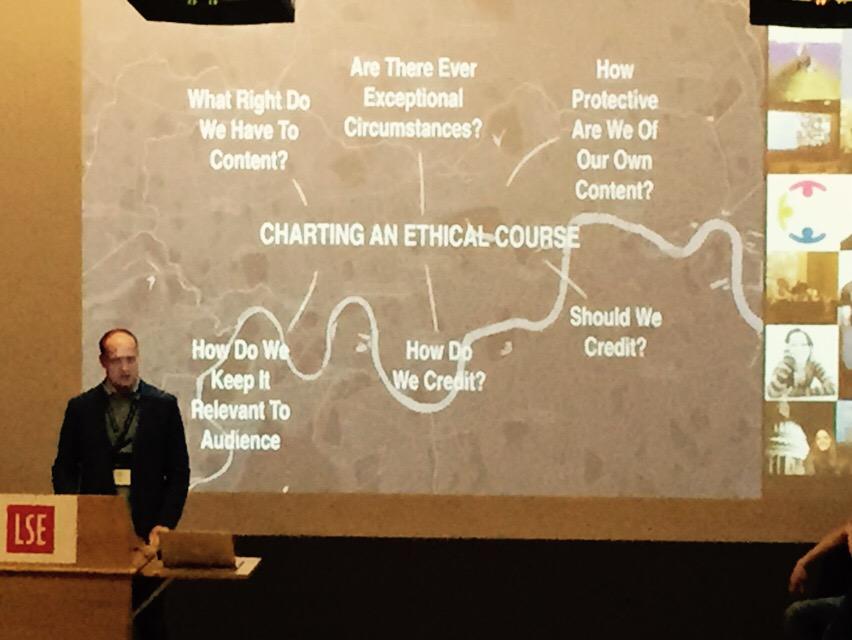
Charlie Beckett (Director, Polis at the LSE) talked about how .....


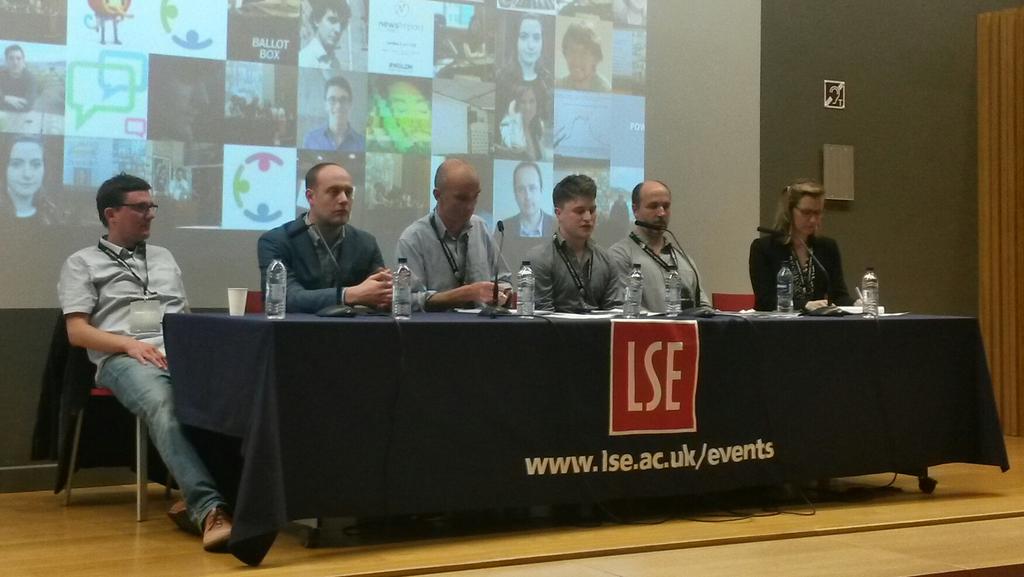
1st Panel Debate - Looking Back #GE2015: From the leading UK media perspectives


On the panel (from left to right in the pic above) were:

Steve Herrmann (Editor, BBC News Online)
Miranda Green (Contributing Editor, Newsweek, Europe)
the moderator of the panel - Charlie Beckett (Polis at LSE)
Jason Mills (Head of Digital, ITV News)
Tom Phillips (Editorial Director, Buzzfeed, UK)


The format of the debate was that each of the panel talked for a bit and then the debate opened up to questions from the audience.


Some of the points Miranda made on some of the features of the election coverage were:

-  the "debate about the debates"
- the difficulty in crystalising the parties views on the fundamentals (vs the noise)

as concerns the poll predictions pre election day

- the New Statesmen's coffee house blog

- how getting a story into print was still seen as the prestige thing

- the polls and political betting

- digital was very good at giving visibility on the scottish issues

- the narrowcasting (vs broadcasting) that went on

- how much of the imagery that made good articles was "traditional" (e.g. Osbourne in a hi-vi)

Charlie mentioned that how even though there was more data than ever the publicity by the parties was more stage managed than ever before


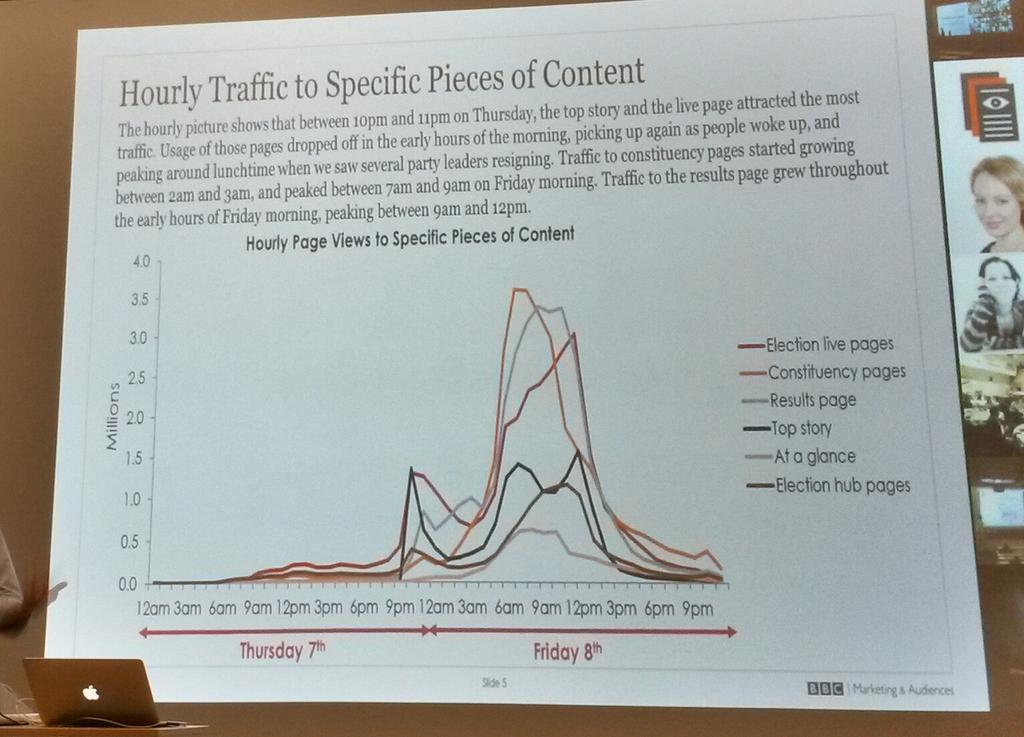
Steve (BBC) then shared some graphs and thoughts ....

the importance of mobile ...

- how traffic spiked by the BBC's different pages (e.g. the day after there was massive interest in the BBC pages on the results for each constituency) - see tweet below

election day traffic
- the BBC had a record election audience digitally - and the big story of the results played out quickly 
- on news coverage of the campaigns the focus tended to be on the big story of the day (which was mainly dictated by the political parties media campaigns)

- the BBC's issue cards (giving background info and data on specific topics) had their highest traffic on election day - so presumably people were looking at the cards to help them choose which way to vote?


Jason then shared some thoughts from ITV's perspective

- mobile and social is how people got their content (the tweet below is about the BBC but ITV focused similarly)

- news items were largely directed and controlled by the parties - nothing seemed to break away from the stories the parties wanted to be told

- lots of short videos seemed to be key
- ITV had a "Rate the Debate" survey that was open to all - it got 30m hits (although the discussion on this suggested there was probably a lot of party activist hammering away voting for their candidate)


Tom from Buzzfeed then talked a bit


- the politicians had very strong message discipline, they seemed to not engage with other parties messages and just kept in their own lane focusing on their message


- Traditional 1/2 hour interviews seemed to work best


In the Q&A session that followed the following observations struck me ...

- there was a big tie up between broadcast and social - but content needed to get up on social really quickly


- Buzzfeed choose not to focus on data content (as the polls were so static pre election)


- Buzzfeed look at the ratio of sharing more than traffic volume and judge posts success in terms of do they find the audience that would want to read it (I assume their success in this is key to what premium in adds to their advert rates due to being more demographically targeted?)


- issues most talked about on facebook - economy & tax

- there were 2 standout debates  - the ITV one  - in that it really presented the multi-party dimension of the election

- and the BBC Question Time one - for the bluntness of the audience questioning and the strength of the reactions of the audience in the room to some of the dodging the politicians did


 - main stories at night seemed to be those in 1st edition print - and when early print editions dropped 9pm ish this could change how broadcast told the news

- Broadcast was desperate for stories but almost all the politicians were talking so vaguely it was hard to get any story other than what the parties were pushing

- is digital more heat than light? - turnout was down and youth voting % was bad


- but maybe its unrealistic to expect media to change how the GB electorate think about politics

- the Conservatives focused a lot on local advertising for specific seats they were targeting - and this wasn't seen from the national media's perspective


- "you don't want to be the Dad dancing in the room"


"there is a massive danger that the media over-estimate its own sophistication versus that of the GB electorate (which is very sophisticated)"


2nd Panel Debate - From Data gathering to visual storytelling

On the panel (from left to right in the pic above) were:

Frederik Ruys (Data Journalist, Nederland Van Boven -VPRO)
Helena Bengttson (Editor Data Projects Team , the Guardian)
Rohan Jayasekara who moderated (he is Technology Hub Adviser, Internews)
Megan Lucero (Date Journalism Editor, the Times & Sunday Times)
John Burn-Murdoch (Data Journalist, the Financial Times)

The format of the debate was that each of the panel talked for a bit, John then interjected a few questions after each session - and after all the panelists had talked the debate opened up to questions from the audience.


Helena talked about a number of stories where she had used data


- a fracking story using a visualisation on a map
- reddit porn - looking at the moderators of the more shady threads and how they also moderate more mainstream threads - how large a part of reddit is shady

- interactive visualisations on pregnancies, income ranges, schools performance, education levels of parents

In the quick Q&A that followed Helena's slot these points interested me

- for some of the maps it took 3 hours to create them

- Helena taught herself to code - but she did this only if she needed to do so for a story

- you need to learn how to talk to developers - in the 1st year she and a developer worked with each other they regularly screamed at each other 


John from the FT then talked a bit 

- you need to have somebody who knows the data - whatever the source - which column to look for
Not just a choice between publicly available data sets and paid ones, web scraping enables you to create your own -

- about the Hanergy story that the FT did - "The best stories come from collaborative working" 

- the data you collect and your analysis of it gives you a competitive advantage

In the quick Q&A that followed these points interested me


- Companies are generally better now at releasing accessible data


- some of the more interesting Government data is often not released

- the amount of "scraping" going on is increasing


Megan from the Times then spokeClose


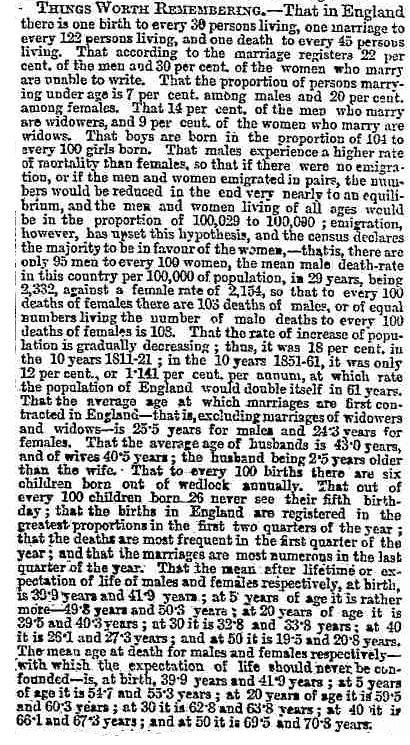
  • Hey , here's that piece from 1868. Data journalism is nothing new. Let's reinvent it.


  • - our data journalism team is investigative and multi-discipline and uses computers to get data to support that investigative journalism  "of the web not on the web"

    - Megan gave examples of matching lists of well know Tax Avoiders (think Jimmy Carr) with other lists to see trends
    - or how for the election they prepared election data with census data and used machine learning so when the results came out 1/2 an hour later they had a simple front end to their analysis up & public

    In the quick Q&A that followed these points interested me

    - when recruiting for the team Megan looked for people who stood outside their realm (e.g. an academic frustrated with the pace of academia who could use their approach more quickly in journalism)

    - data journalism is far more collaborative then "traditional" journalism due to the need for multi-discipline teams 


    Then Frederik showed us some clips from some broadcast data journalism


    In the Q&A that then happened at the end of all of the panelist sessions these points interested me

    - the Netherlands animations affected the public debate about the risk of flooding in the Netherlands and how evacuation wasn't an option (in the once every 10000 years scenario) as the bulk of the country would be flooded (so nowhere to evacuate to)

    - they shared the data online for each local area

    - to find the story in the data it helps if you have somebody who knows that patch


    .: Being a data journalist is simply that you interview datasets instead of people. View photo


    - one of the panelists discovered a Ghost Patients story when comparing data on how many patients some GPs had with the population for the area  - they noticed that the GPs seemed to have more people on their registers than actually lived in the area

    - its a difficult time balance between exploring the data versus meeting deadlines for a story - and yet still avoiding data churnalism


    Returning after lunch we then has some choices of 1 hour workshop slots running two at the same time


    Workshop 1 - Data journalism with financial data - with John Burn-Murdoch - I didn't attend this and at the same time Workshop 2 - Google geo tools for journalists - with Matt Cooke


    google alerts is a good way of keeping up to date with the latest on specific subjects on the web or on social media

    If you want information on storytelling using google maps - and getting the latest imagery - try the link in the tweet below

    If you want the detail on google's media tools use the link in the tweet below

    Fusion tables is a way of fusing 2 sets of data to create a map of such data - so examples given included

    - a map of military deaths in Iraq

    - or a map of a city in terms of hotel rates and airbnb rates

    - or a map showing firearm ownership

    You can make custom maps using google my maps - for example see the picture in the tweet below showing what one news organisation did concerning the flight path of a plane and adding their own custom legend (on the left) to indicate events during that flight

    if you are mobile there is a google maps android app that journalists can use for reporting from the field

    and for further maps customising (programming skills needed) you can use google maps api

    or you can compare street views over time - so an example of this before and after approach on an areas gentrification is shown in the picture in the tweet below (to use this feature go to google street view using the stickman  - then look for the clock symbol in the panel toward the top left hand corner  - clicking on this you can see which street views from which dates in history are available)


    Or you can use the street view in google maps to show the street level view before an event - (like a major new building or a disaster) and then use the latest streetview pictures - or your own picture content  - to show how it looked after the event - see the example in the tweet below (which has before and after pictures on a natural disaster)
     
    Very arresting treatment of post disaster coverage using Google maps but you do need to get the new images


    or you can create a photosphere of inside a building and post that on google maps

    turning to google earth....google earth pro is a tool which is now free

    and apparently you can use google earth to create

    -  fly through 3D videos

    - or views of areas remote from access (e.g the oil refinery hostage story in Algeria)

    there is also google crisis response as a resource - see the tweet below


    On permissions and licencing the advice was that its OK to embed google map/earth images into blogs and such like but if you want to use their pictures in broadcast then ask google first


    Workshop 3 - Engagement through data for better storytelling - with Alison Rockey (Engagement Editor, VOX.com )

    Alison explained what Vox is about

    and by way of an example of the working out of the mission statement above  - she cited the way they did an interview with Obama and added in various graphics


    In building a social newsroom Alison explained how they wanted 

    - everyone (technical & journalists & product specialists) working together in the same space so they could understand each other 

    - so that it became a newsroom of social experts

    - so  writers know how their stories perform on social

    - so there are weekly lessons on best practices

    Building a social newsroom step four - journalists are more than just writers


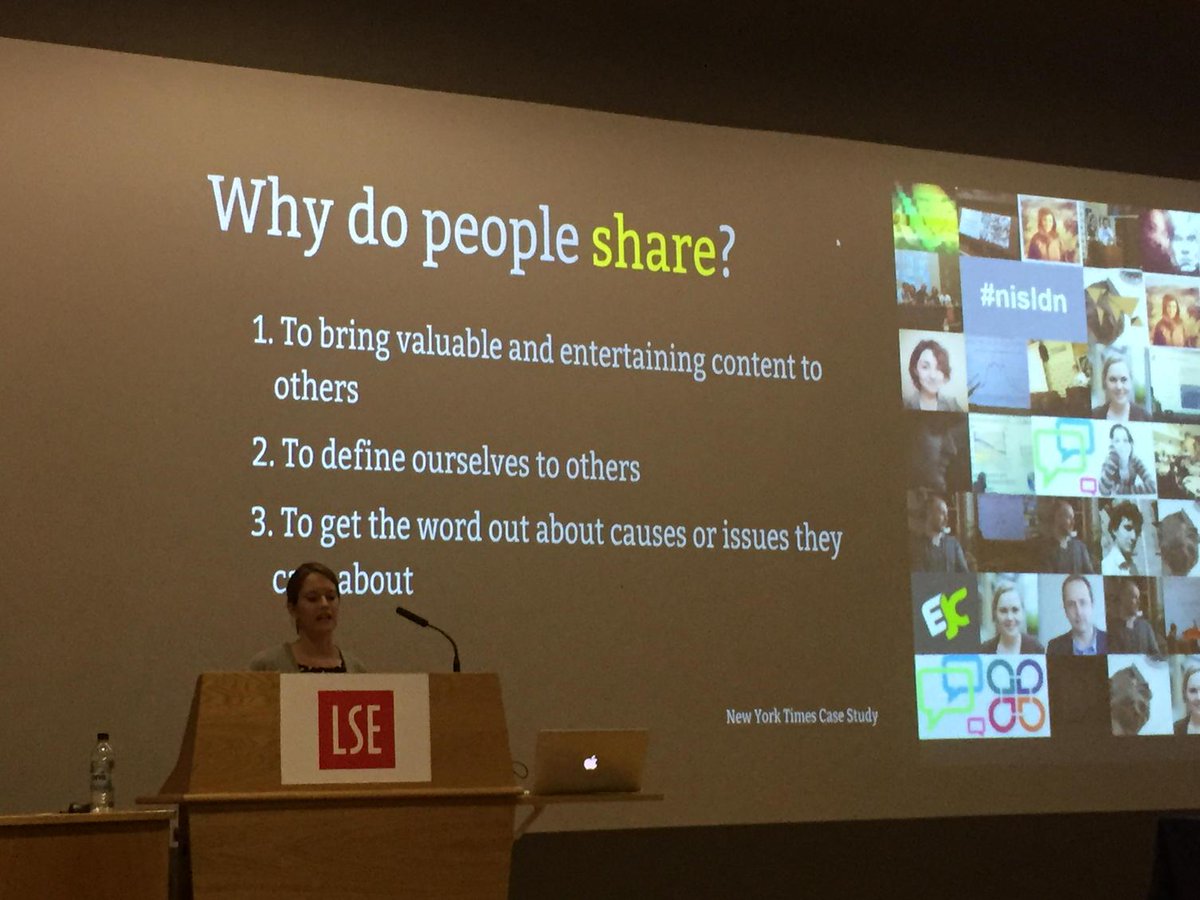
    Alison went on to stress the importance of knowing your audience and why they share stuff socially

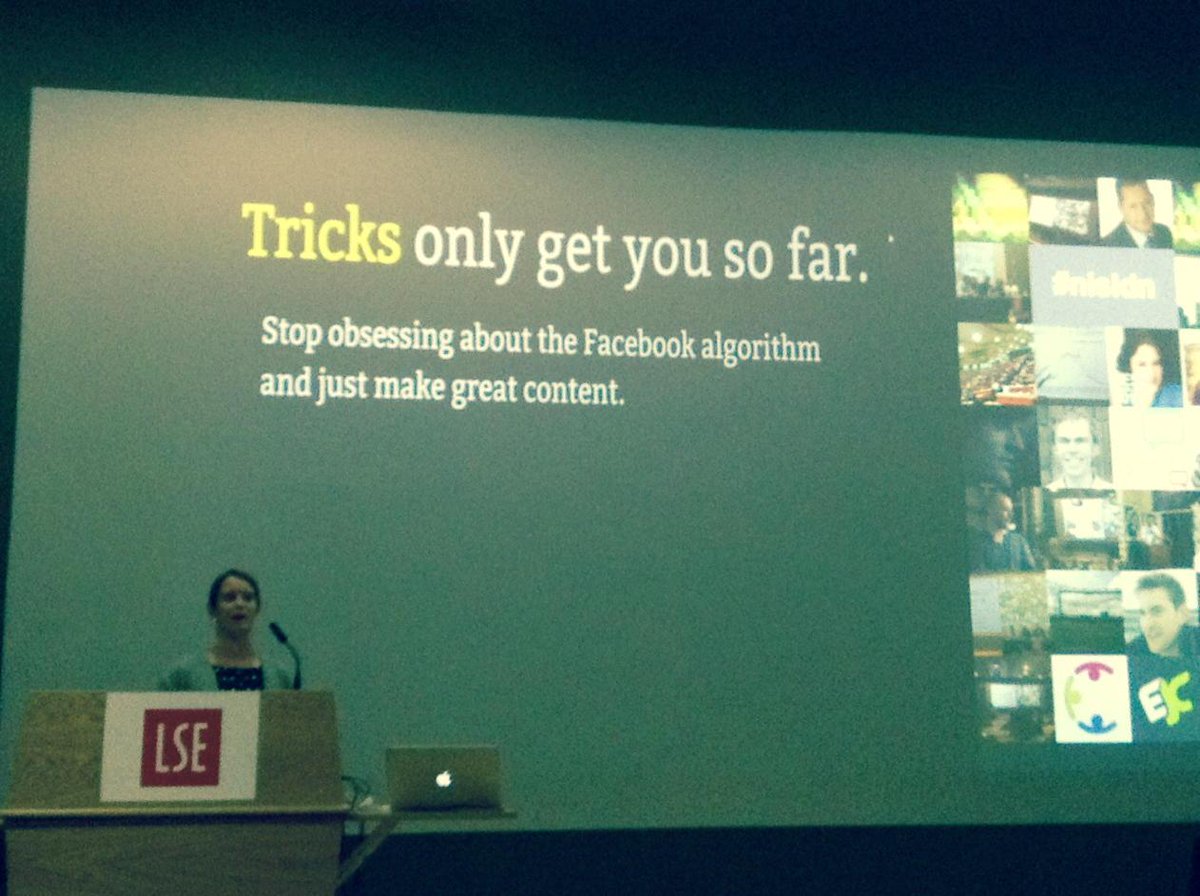
    she also had some advice about algorithm fixation

    Alison also gave the example of the story behind the ebola graphic below ...

    they created the Ebola graphic - (which with a hindsight view appears from a UK perspective to be snarky  - but from what Alison said it wasn't done with that intent) because

    a) when the 1st Ebola case was reported in the USA people really were freaking out about it

    b) so they wanted to create something to inform & calm the situation down

    c) and they were able to do the graphic because behind it was work they had already done - based on some solid journalism where the experts had been talked to in detail so the journalists knew how Ebola actually spread

    In summary her advice was direct and clear

    In the Q&A that followed the following issues interested me


    - they have a team of around 35 with some 20 or so writers and the rest work on the product


    - yes their journalists get outside the office on stories


    - the writers generally get their pieces out quickly and post several time a day


    -  yes they have to balance the quick win story with the deeper research needed for some stories

    - they chose not to have an app as their website was designed with a mobile focus

    - her background is advocacy - so she was thinking about how they make sure the viewer comes back, or signs up to an email newsletter or connect via social media

    - they post every 45 minutes or so on facebook and every 10 minutes or so on twitter


    - video on facebook does very well


    Workshop 4 - War crime investigation: finding evidence through UGC - with Christopher Koetti (Advisor on technology & human rights, Amnesty International) - I didn't attend this


    Workshop 5 - Animating data for visual storytelling - with Frederick Ruys - I didn't attend this


    Workshop 6 - Using Google tools for journalistic research - with Paul Myers (Researcher, BBC) - I didn't attend this but have picked out some of the relevant tweets below


    Live demo of The Journalist Toolbox:  


    1.  


    Panel Debate 3: War investigation & user-generated video verification - I didn't attend this 


    General Session - Prototyping the future of news - I didn't attend this but have picked out some of the relevant tweets below


    other posts on RSA, TED, other lectures, conferences, others blog posts
    11 headlines on why we use facebook & social media - summarised out of a very rich buffer post by Courtney Seiteron  
    18 top tips and thoughts about using #social media to enable #community source = an article by  Anatoliy Gruzd PhD & Caroline Haythornthwaite PhD 

    2014
    Data Protection & Privacy - 8 issues from an International Conference
    escape your social horizon limit & understand more - source = a blog post summarising the work of  Jeffrey A. Smith, Miller McPherson & Lynn Smith-Lovin
    social media & death - 10 things you may not have thought about - #DORS conference

    2013
    the development of the U2 spyplane - source = CIA historians Gregory Pedlow & Donald Welzenbach
    considering culture and business process improvement  - source = an article by Schmiedel, Theresa, vom Brocke, Jan, & Recker 
    ideas that may help you attract older volunteers - source = a paper by Brayley, Nadine, Obst, Patricia L., White, Katherine M., Lewis, Ioni M.,Warburton, Jeni, & Spencer, Nancy
    physical factors which help people get better quicker - source = a paper by Salonen, Heidi & Morawska, Lidia 
    a new approach to school and education - by Geetha Narayanan 
    guiding principles on designing construction kits - by Mitchel Resnick & Brian Silverman
    signs of overparenting - source = an article by Locke, Judith, Campbell, Marilyn A., & Kavanagh, David J
    making ideas happen - source = a 99U conference

    2012
    how to spot a liar - by pamela myer 
    measuring happiness - source = talk by jim clifton, jim harter, ben leedle

    2006  twittr launches

    2005  youtube

    2004  the facebook online and digg

    2001  wikipedia

    1999  weblog software launched

    1998  Google

    1996  HoTMaiL

    1995  auctionweb

    1994  CERN release a web browser

    1984  Apple Macintosh launched

    1977  IBM personal computer

    1976  mail via computers